
Physical Risk
Understand physical risk to any asset in minutes.
Upload thousands of assets — offices, factories, employees, anything with an address or lat / long — and get an immediate, audit-ready risk assessment across wildfire, flood, heat waves, water scarcity and more.
California SB 261 · EU CSRD · IFRS S2 / TCFD · Australia AASB
Asset risk map
38 assets
Asset assessment
Headquarters
6 hazards scored
Unlimited
Assets per portfolio — no per-asset fees
6+
Physical hazards modeled across four scenarios
Audit-traced
Every risk score sourced and reviewable
Minutes
From upload to a full risk breakdown
Trusted by legal, risk, and sustainability teams across the enterprise


Easy data uploads
Upload thousands of assets in minutes — not weeks.
Consultants take weeks to sift through spreadsheets, returning results that are already stale. With Beehive, you upload the address or lat / long of any asset and immediately see a risk breakdown across every major hazard.
- Any address, ZIP code, or lat / long
- Offices, factories, suppliers, employees, customers — anything with a location
- Bulk-upload thousands of assets at once
- No per-asset fees — assess your entire portfolio in one view
Asset portfolio
2,418 assetsHouston Distribution Center
Houston, TX
Sacramento Plant
Sacramento, CA
Rotterdam Office
Rotterdam, NL
Singapore HQ
Singapore
See it on the map
Every asset, scored across every hazard.
The moment assets land, Beehive plots your whole portfolio on a risk map and scores each location — wildfire, flood, heat and more — with the underlying detail behind every score.
Explore asset locations and physical climate exposure.
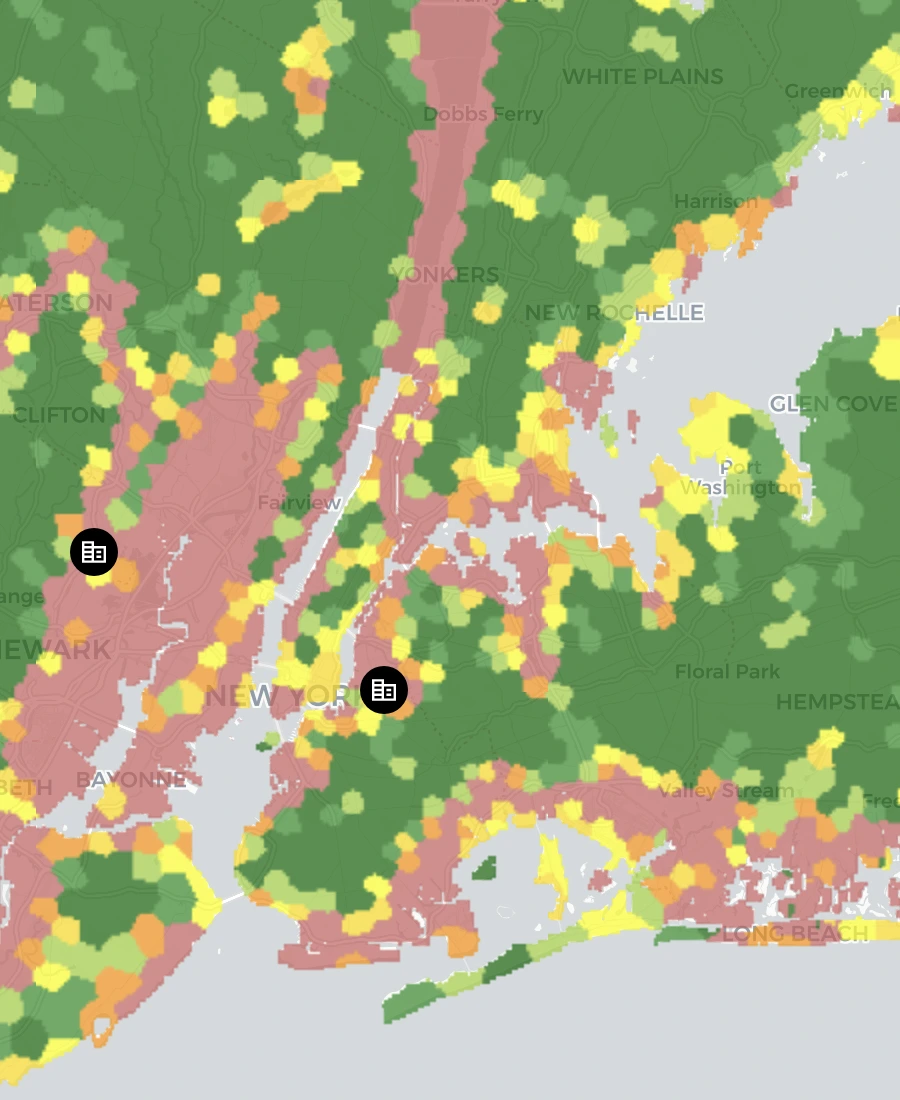
Office: New York HQ
Brooklyn, Kings County, NY
Asset details
This location ranks in the highest range of flood-risk metrics across the assessed portfolio.
Flood plain characteristics
- 50-year flood extent: 40% of land area
- 200-year flood extent: 70% of land area
- Median inundation depth: 1.2 m
Projected flood risk
Extreme-rainfall probability change relative to historical levels: 1%.
Hazard coverage
Every major physical hazard, modeled across scenarios.
Beehive models the likelihood and severity of each hazard across multiple time horizons and climate scenarios — auditable and transparent, so your team can trust the source.
Wildfire
Burn probability and ember exposure by asset.
Flood
Coastal, riverine, and surface-water flooding.
Heat waves
Extreme-heat days and cooling-demand stress.
Cold
Extreme cold-days and stretches.
Drought
Water scarcity and prolonged dry spells.
Cyclones
Hurricanes, typhoons, and tropical cyclones.
Sacramento Plant · Wildfire
Audit trailHigh
Exposure score · 74 / 100
- Data source
- Beehive hazard model · v4.2
- Model
- Burn probability + ember exposure
- Scenario
- SSP 1-1.9 | 2026
- Last updated
- Today
Audit-ready
Risk scores your finance, legal, and assurance teams can stand behind.
You're assessing risk to tell your board and investors what they should be most concerned about. An expensive consultant saying "trust me" — or a ChatGPT query with a 20% chance of hallucination — isn't going to cut it. Every Beehive data point has an audit trail, so you can learn the source and have confidence in the results.
- Every score traces back to its underlying data source
- Transparent models and named climate scenarios
- A reviewable trail for finance, legal, and external assurance
Dynamic dashboards
Risks summarized instantly — in a dashboard you can share.
A map of your risks is useful. A way to break it down by category and prioritize according to your needs is better. Beehive summarizes your portfolio the moment assets land, in a dynamic, shareable dashboard your whole team can work from.
- Break risk down by hazard, asset type, or geography
- Create and download charts for any view
- Share a live link with stakeholders in a click
Portfolio risk · by hazard
Model financial impact across assets and hazards.
Total climate risk
$37.6m
Highest-risk asset
$14.7m
Highest-risk country
$17.1m
Most impactful hazard
$21.3m
Risk by hazard
Risk forecast over time
Risk calculator
Quantify physical risk in dollars.
Exposure scores tell you where the risk is. Beehive's AI-powered risk calculator tells you what it could cost — translating physical hazard exposure into expected financial impact, so risk becomes a number your finance team and board can act on.
- Translate hazard exposure into expected financial loss
- Model damage, downtime, and recovery by asset
- Put a number your board understands behind the risk
AI assistant
AI that helps your team act on risk — not just see it.
Extract
Pull the risk data you need
Ask the embedded AI to surface exposure for any asset, hazard, or scenario — no spreadsheet spelunking.
Understand
Make sense of the results
Turn scores and charts into plain-language explanations your finance and legal teams can follow.
Decide
Choose resilience measures
Get grounded options for reducing exposure across your portfolio, prioritized by impact.
Communicate
Brief your stakeholders
Draft board-ready summaries and disclosures straight from your risk data — in your words.
Physical risk FAQ
Clear answers on assets, hazards, and financial exposure.
How Beehive models physical climate risk, quantifies impact, and keeps every result reviewable.
What physical climate hazards does Beehive assess?
Beehive assesses wildfire, flood, extreme heat, hurricane and cyclone, drought, sea level rise, water scarcity, and other physical hazards using hazard-specific datasets and model lineages.
What assets can Beehive assess?
Beehive can assess facilities, supply-chain locations, employee and customer locations, linear assets such as pipelines or routes, and polygons such as farms or forests. The platform is designed for anything with a location and a business value attached to it.
Can Beehive quantify physical risk in financial terms?
Yes. Beehive translates hazard exposure into dollar-denominated financial impact, including expected losses, revenue at risk, asset-value impairment, and capital-expenditure exposure.
Are Beehive physical-risk scores auditable?
Yes. Outputs trace back to the asset inputs, hazard model, scenario, time horizon, assumptions, and equations used to generate them so reviewers can inspect the evidence chain.
Get started
See your physical risk across every asset.
See how sustainability, finance, and legal teams assess physical climate risk across their entire portfolio — and turn exposure into decisions — in minutes.